
Overlay blue

Insight X

SaaS Operations Intelligence

Insight X is a business intelligence platform that helps enterprise teams monitor operations, track performance, and respond to critical issues through real-time analytics, alerts, and actionable insights.
Enterprise Dashboard
Operations Monitoring
Real-Time Analytics
Alerts Management
Business Insights
Performance Tracking
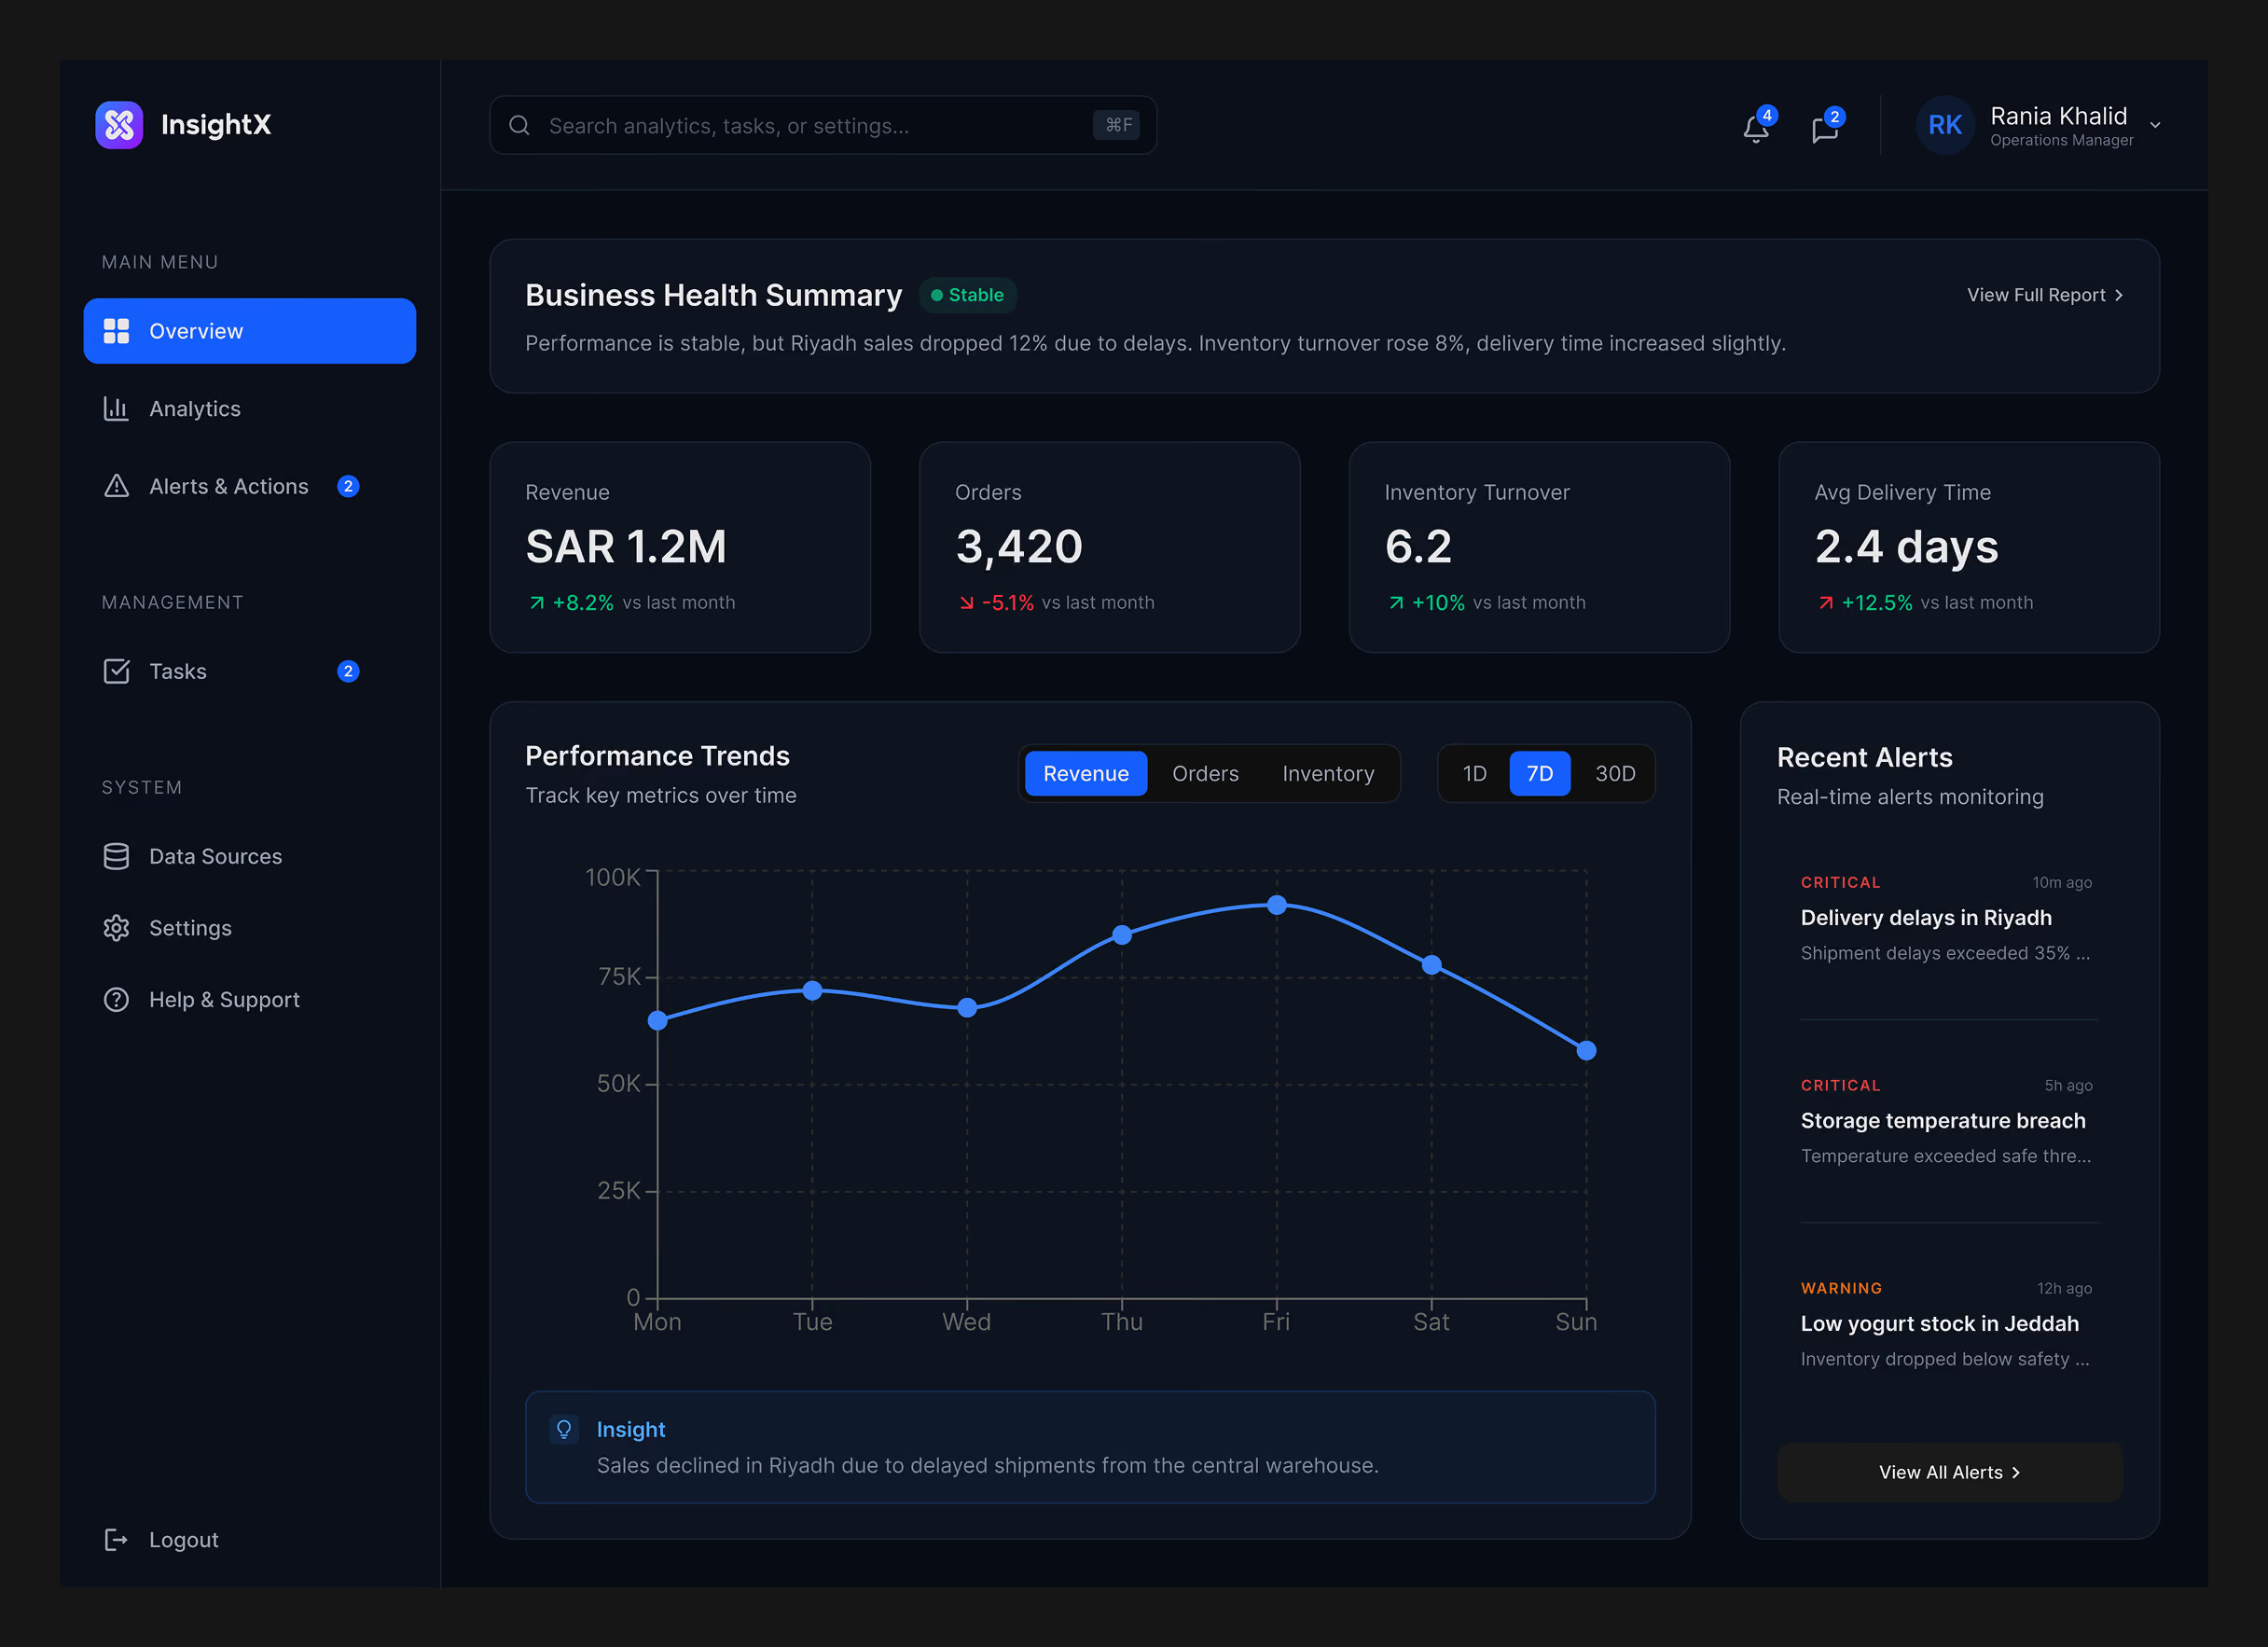
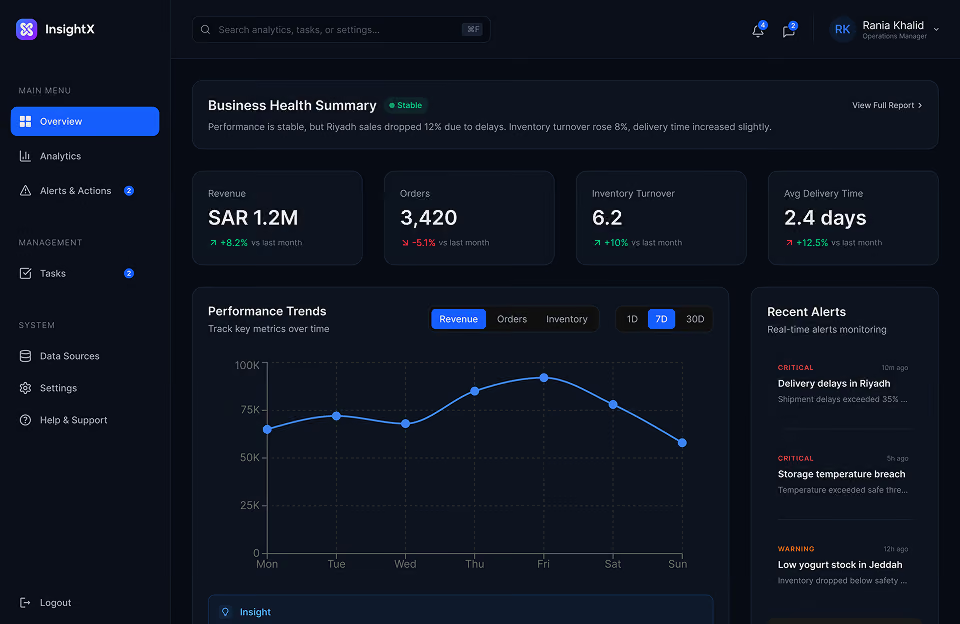
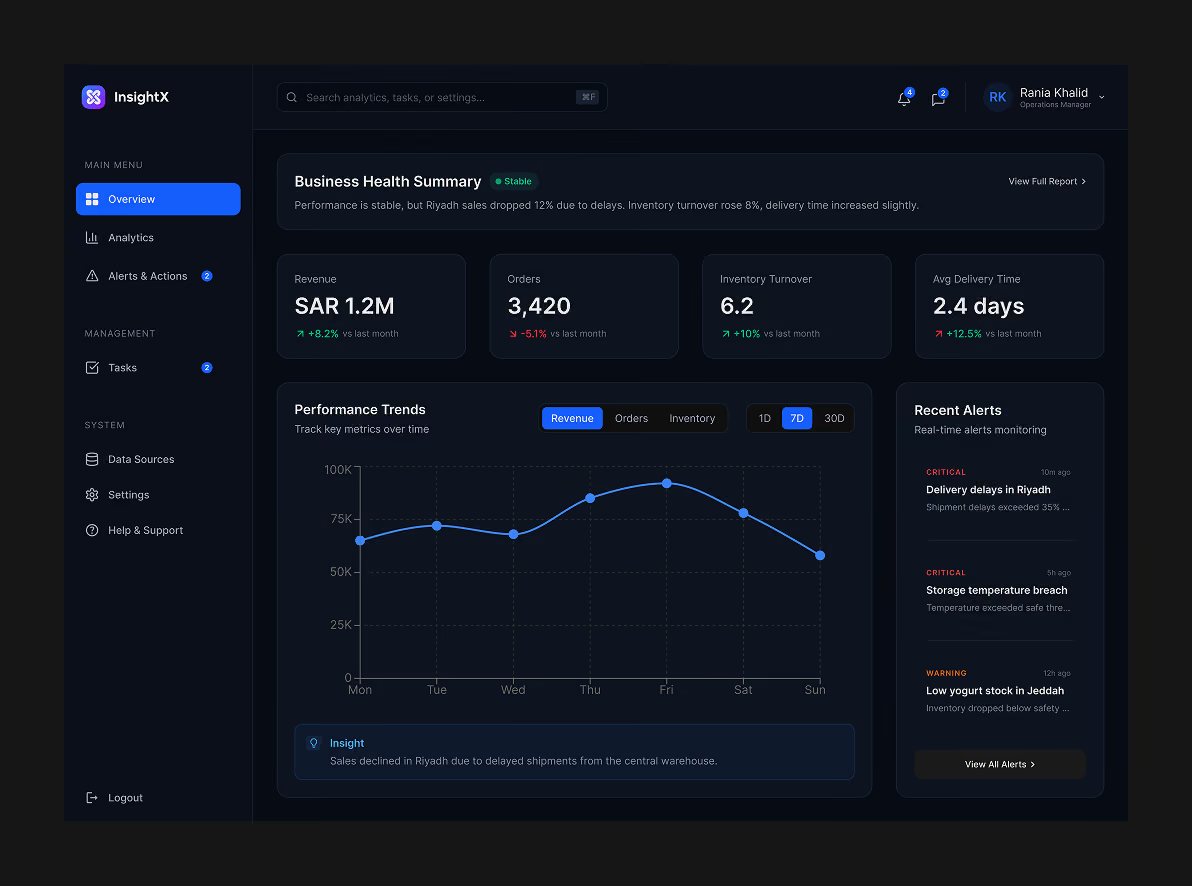
Dashboard showing business health with revenue, orders, inventory turnover, delivery time, trends graph, and alerts.
Role
UX/UI Designer
Duration
11 Months
Duration
Part of a 2+ year
Tools
Figma, Ps, Ai
Sector
B2B / Analytics

Project vision

gradient stroke
The vision

Insight X was designed to simplify and centralize business operations monitoring for enterprise teams. Inspired by modern analytics and operational intelligence platforms, the system helps organizations track performance metrics efficiently, detect operational risks faster, and make more informed business decisions through real-time insights and analytics.

The goals
Improve visibility across operations and performance metrics.
Help teams monitor analytics in real time.
Reduce delays in detecting critical issues.
Simplify complex data through structured dashboards.
Centralize analytics, alerts, and operational insights.

Business challenge

Before Insight X, teams faced fragmented analytics, limited visibility, and slow manual reporting. This caused delayed decisions, slower responses, and difficulty tracking key operational insights.

limited operational visibility icon
Limited operational visibility
Limited visibility into business performance.
fragmented analytics systems icon
Fragmented analytics systems
Business data is spread across tools.
delayed issue detection icon
Delayed issue detection
Operational risks are identified too late.
manual reporting burden icon
Manual reporting burden
Teams rely on manual reporting workflows.
slower decision making icon
Slower decision making
Insights are difficult to access quickly.
complex data interpretation icon
Complex data interpretation
Dashboards hold too much information.
Dashboard showing business health with revenue, orders, inventory turnover, delivery time, trends graph, and alerts.

My process

Horizontal wavy white connecting line with circular nodes on gray background.
1. Discovery
Analyzing workflows, analytics needs, and business monitoring challenges.
2. Definition
Defining platform goals, operational needs, and analytics dashboard requirements.
3. Ideation
Exploring dashboard layouts and scalable analytics experiences.
4. Design
Designing a clear business intelligence interface focused on usability and hierarchy.
1. Discovery
Analyzing workflows, analytics needs, and business monitoring challenges.
2. Definition
Defining platform goals, operational needs, and analytics dashboard requirements.
3. Ideation
Exploring dashboard layouts and scalable analytics experiences.
4. Design
Designing a clear business intelligence interface focused on usability and hierarchy.
Black thin line with evenly spaced small circles along its length on a transparent background.
5. Prototyping
Creating flows to validate analytics navigation and monitoring.
6. Deliver
Preparing design specifications and reusable enterprise components.
Abstract wavy pink and purple gradient background with connecting light blue curved lines
4. Design
Designing a clear business intelligence interface focused on usability and hierarchy.
5. Prototyping
Creating flows to validate analytics navigation and monitoring.
6. Deliver
Preparing design specifications and reusable enterprise components.
5. Prototyping
Creating flows to validate analytics navigation and monitoring.
6. Deliver
Preparing design specifications and reusable enterprise components.

Target users

Insight X is designed for cross-functional teams that rely on accurate, real-time data to maintain operational integrity and drive strategic decisions.
Operations managers
Monitor performance, track alerts, and address critical issues across departments.
Business analysts
Use dashboards to analyze metrics, monitor trends, and generate insights.
Executive teams
Monitor business health, key KPIs, and support strategic decisions confidently.
Supply chain teams
Track logistics, inventory, and disruptions in real time to optimize flow.

Product experience

gradient stroke
1. Dashboard overview
A centralized dashboard that gives operations teams clear visibility into business performance, operational health, analytics trends, and critical insights across departments and regions.
Business Metrics
Performance Trends
Operational Insights
Real-Time Monitoring
Dashboard showing business health with revenue, orders, inventory turnover, delivery time, trends graph, and alerts.
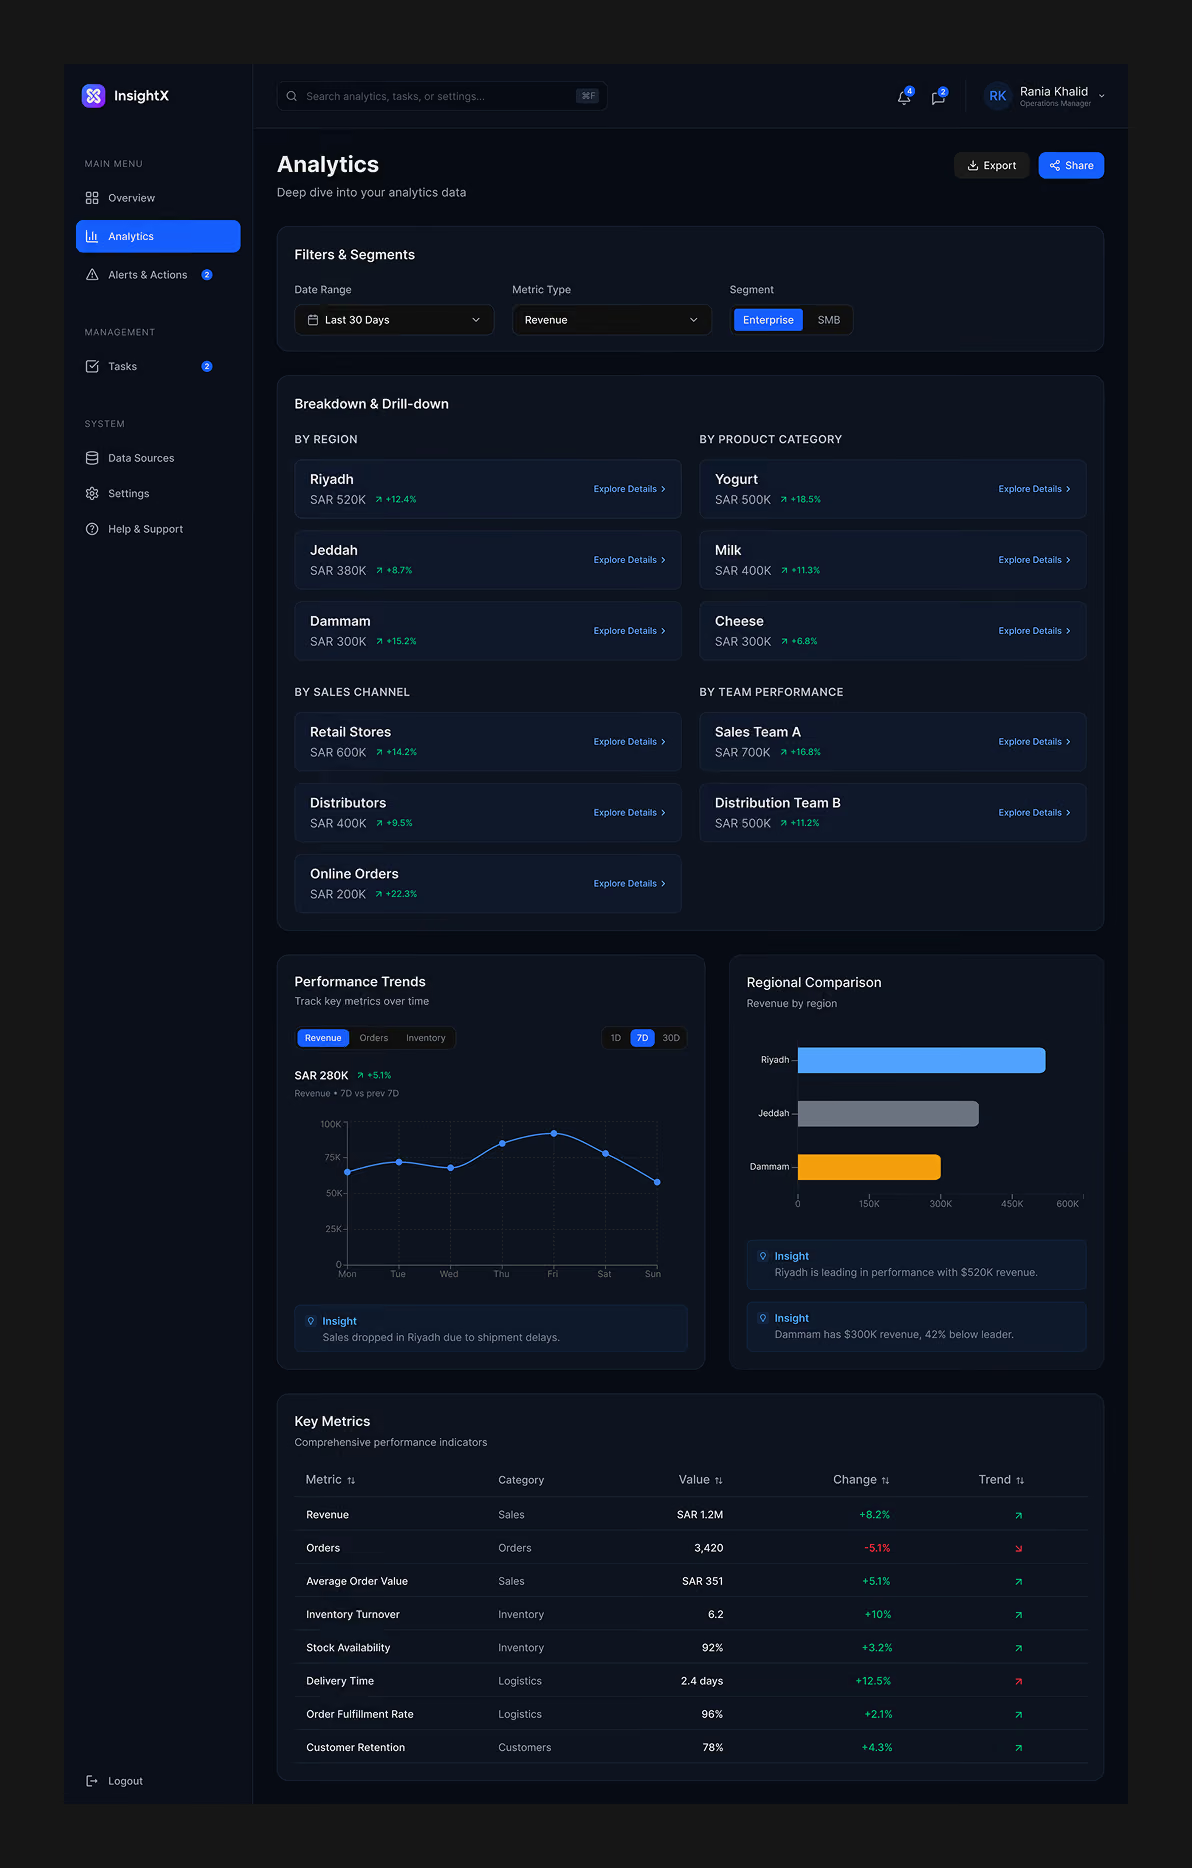
2. Analytics workspace
An analytics experience designed to help teams explore performance data, compare operational metrics, and track business trends through structured visual dashboards.
Revenue Analytics
Regional Comparison
Data Visualization
Performance Tracking
InsightX analytics dashboard with sales data by region, product, channel, team, and performance trends.
3. Alerts & Actions
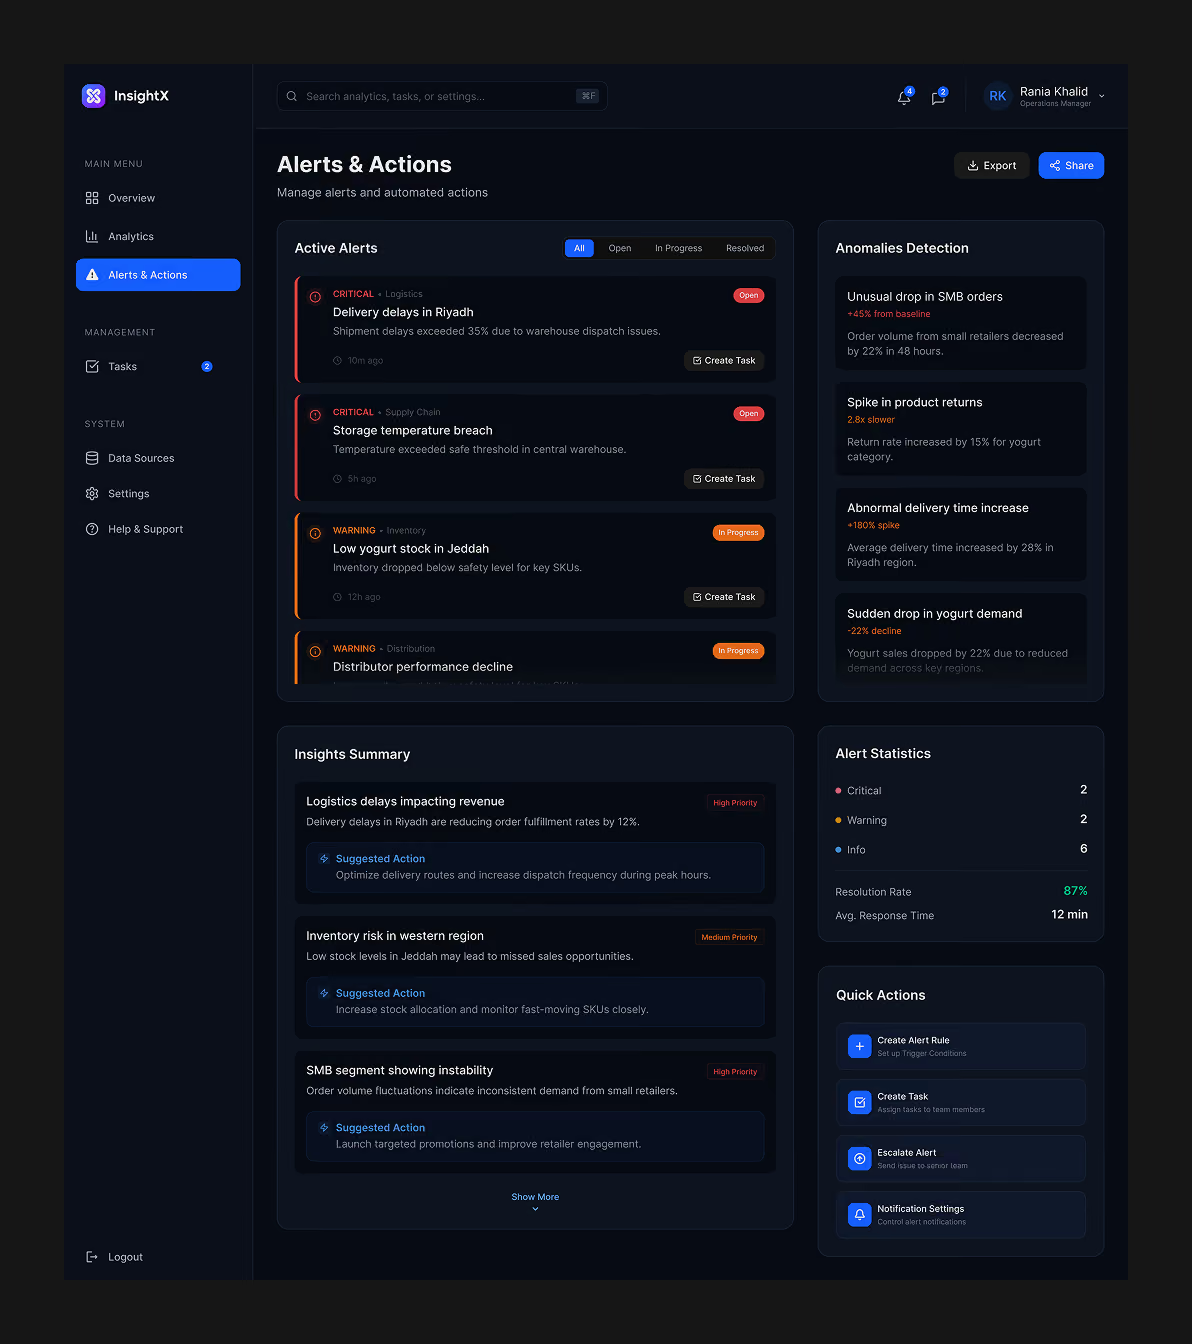
An operational alerts interface that helps teams detect anomalies, monitor critical incidents, and manage operational responses more efficiently.
Alert Management
Anomaly Detection
Suggested Actions
Issue Monitoring
Dashboard interface showing alerts, anomaly detection, insights summary, alert stats, and quick action buttons.

Product strategy

The product strategy aimed to simplify monitoring workflows, enhance analytics visibility, and structure business intelligence for enterprise teams.
01
Operational visibility
Giving teams clearer visibility into performance and operational insights.
02
Structured analytics
Creating organized dashboards for monitoring and decision-making.
03
Faster response actions
Helping teams detect issues faster through clearer alerts and insights.
Strategic design principles
PRINCIPLE 01
Clear analytics hierarchy
Designing structured dashboard layouts that make operational data easier to scan and understand.
PRINCIPLE 02
Consistent monitoring flows
Maintaining organized analytics and operational workflows across the platform experience.
PRINCIPLE 03
Focused insights experience
Helping teams monitor performance trends and operational risks more efficiently.
PRINCIPLE 04
Simplified operations management
Organizing analytics, alerts, and monitoring tools within a scalable enterprise workflow system.

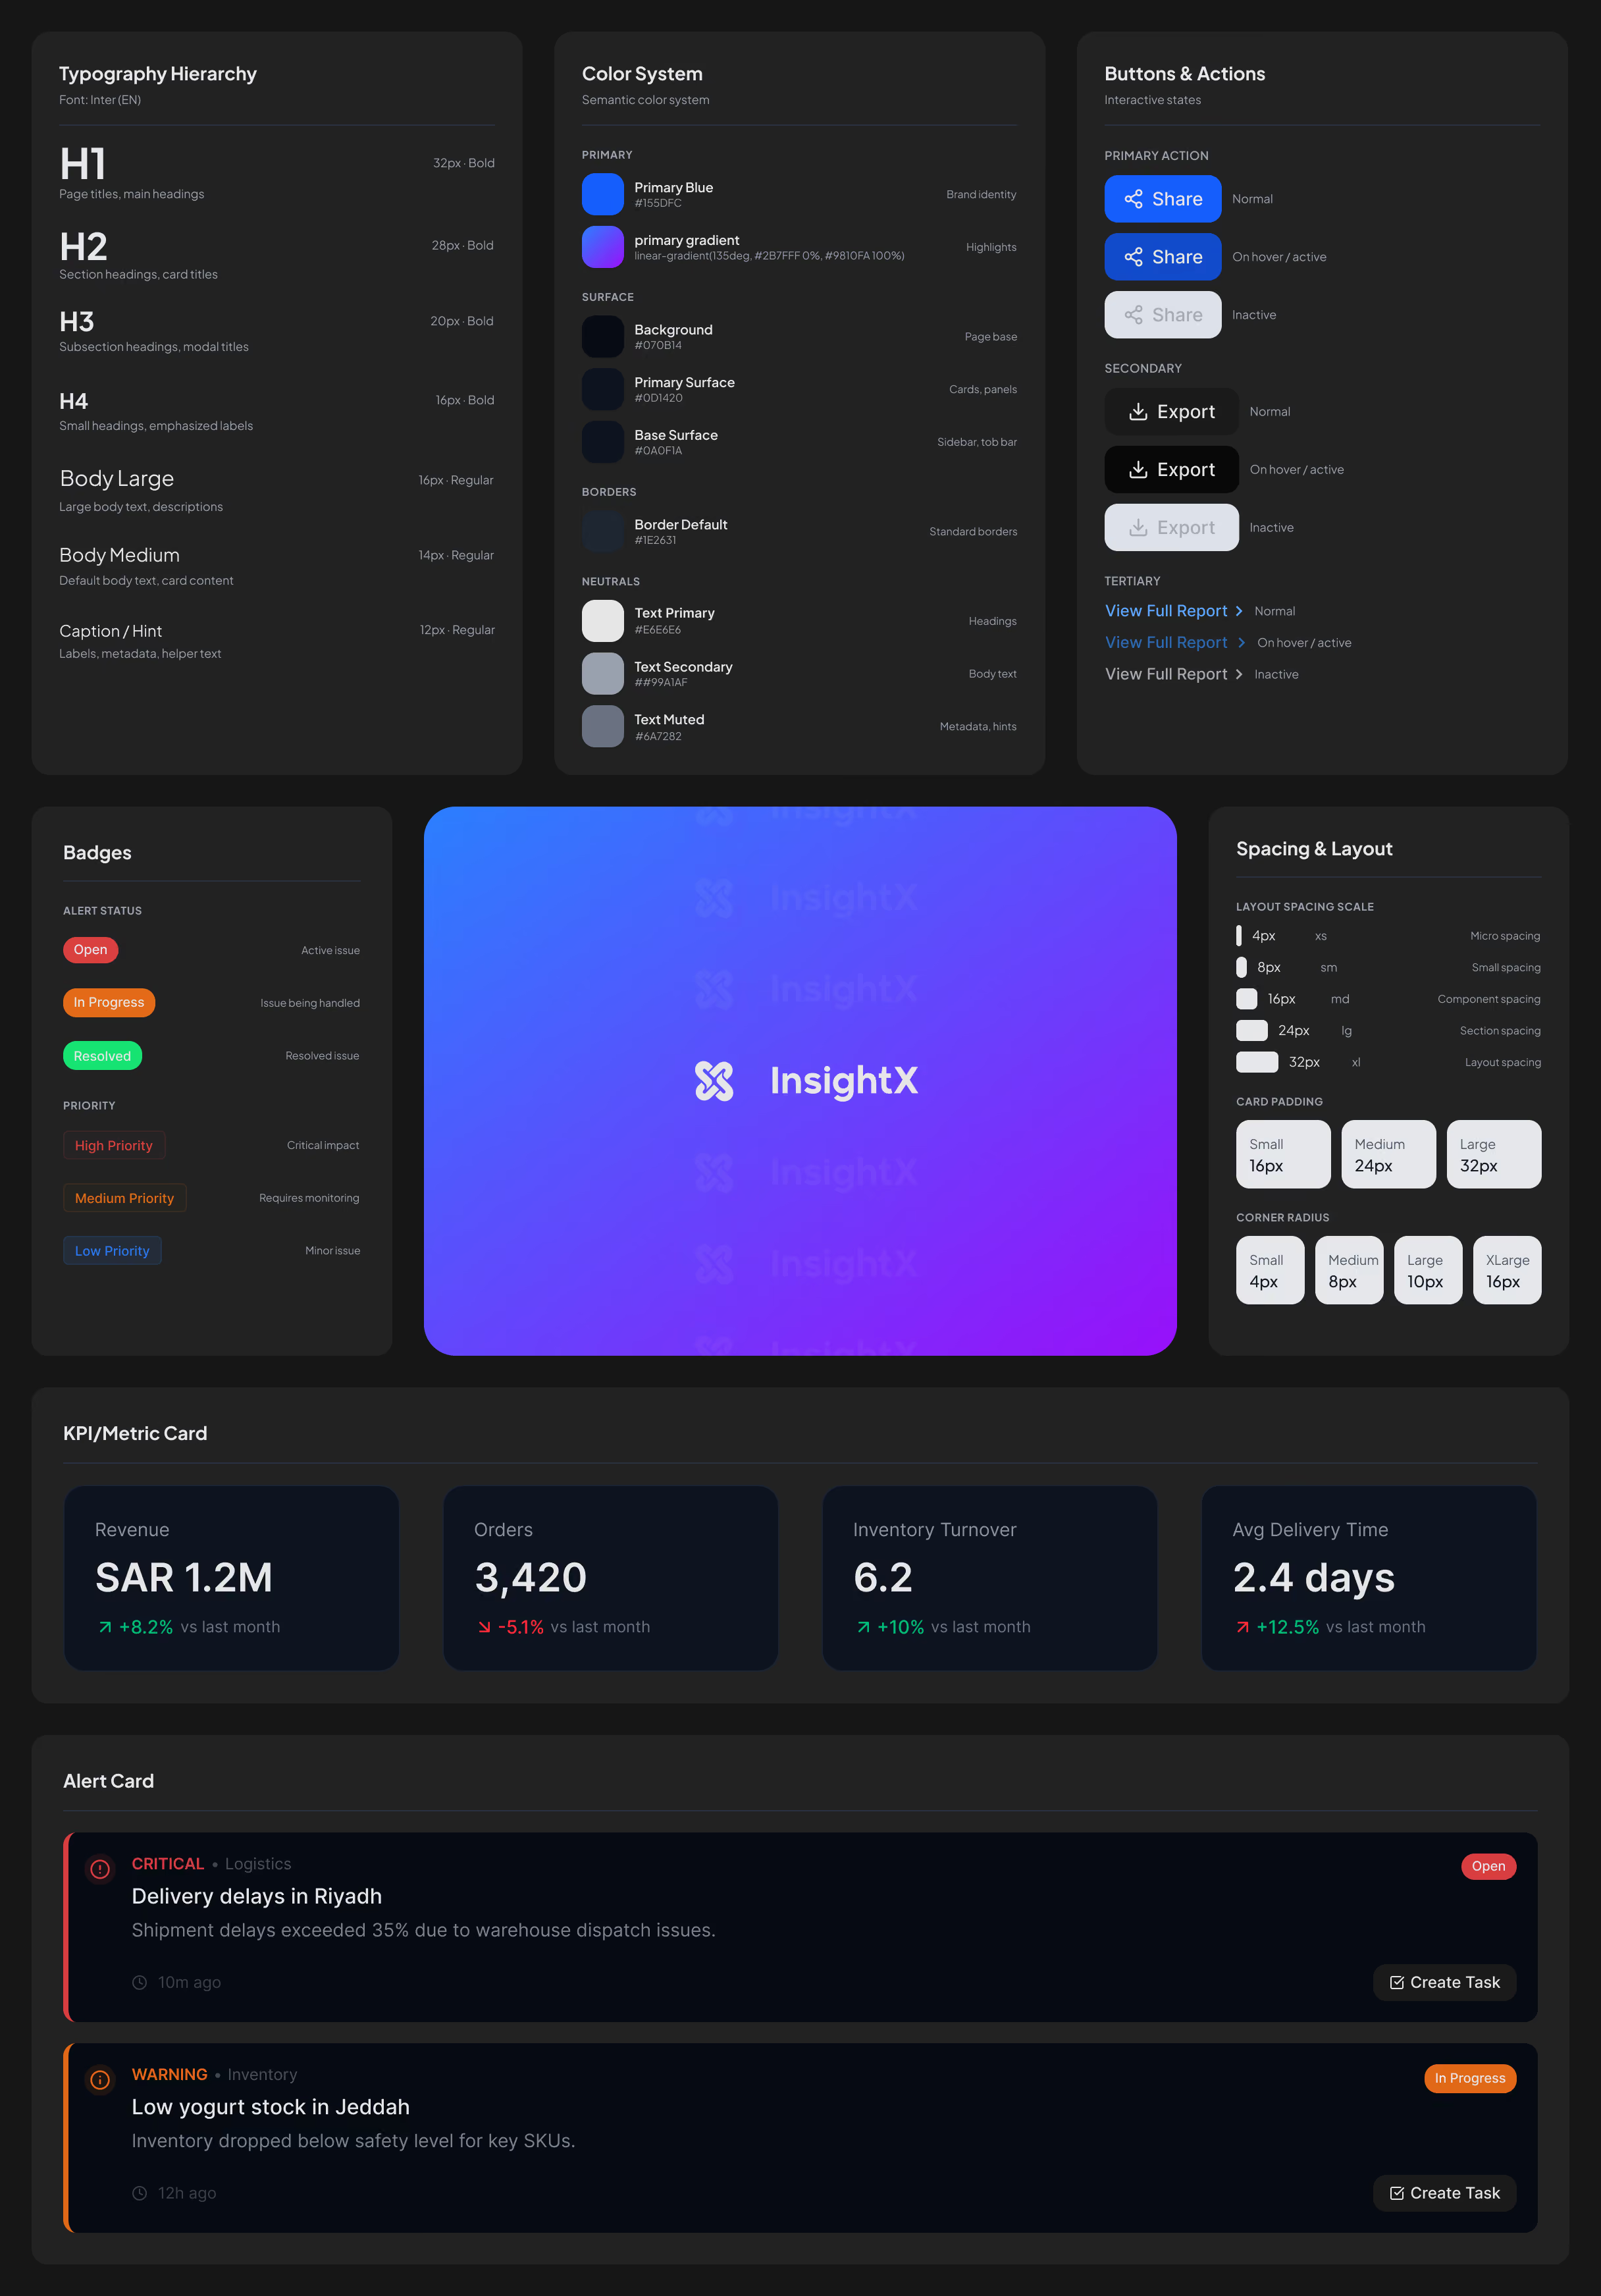
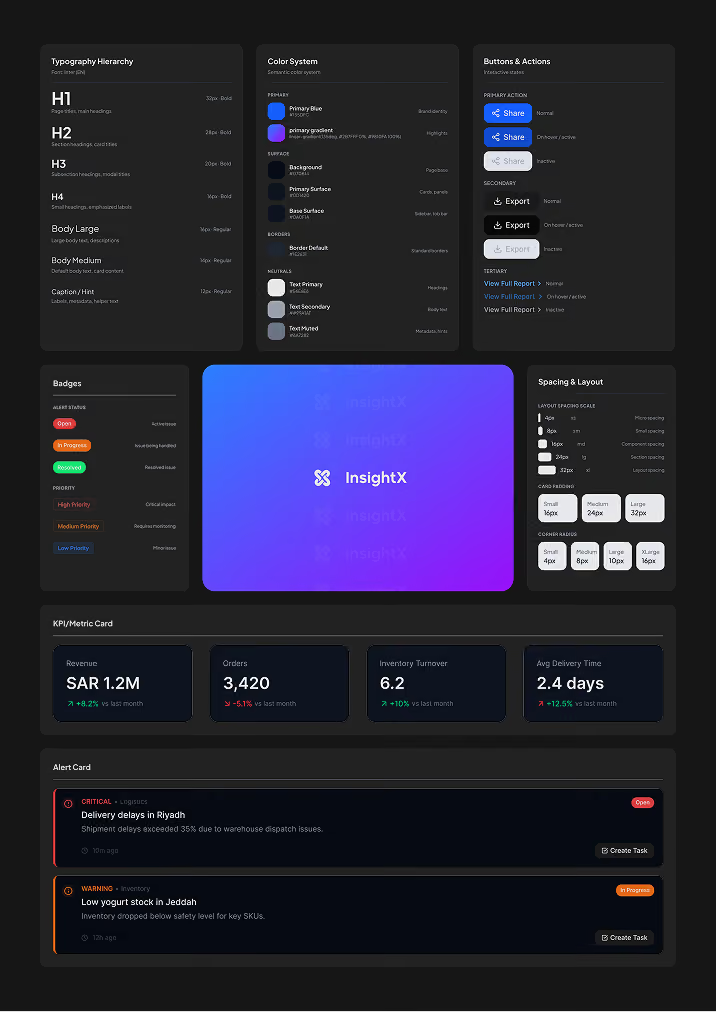
Sticker sheet

Dark-themed dashboard UI with typography, color system, buttons, badges, spacing, metrics, and alert cards.Dark-themed dashboard UI with typography, color system, buttons, badges, spacing, metrics, and alert cards.

Business impact

Insight X enhanced operational visibility and simplified analytics, helping teams respond faster with centralized dashboards and insights.

Key outcomes included:
Faster Detection
Analytics Visibility
Better Monitoring
Business Insights
Simpler Reporting
Faster Decisions
Operational Awareness
Faster issue detection
Improved analytics visibility
Structured monitoring workflows
Better operational awareness
Simplified reporting workflows
Clearer business insights
Faster decision-making
Key insight
Clear analytics and centralized visibility helped teams monitor performance faster, identify risks earlier, and make informed decisions.

Reflection

Key insights
01
Operational workflows become more effective when analytics visibility, alert prioritization, and business insights are clearly structured.
02
Simplifying operational monitoring helped reduce friction between teams and improved response speed during critical business issues.
03
Consistent dashboard patterns and organized analytics workflows improved scalability and supported faster operational decision-making.
Growth
InsightX improved my grasp of analytics workflows, dashboard usability, and monitoring systems.
The project enhanced my skill in designing clear, visible, and decision-focused interfaces.